
INDIANA, USA — In the summer, temperatures can vastly differ from in town to rural areas, even in a span of just a few miles. Different surfaces absorb and release heat at varying intensities. There can be a 20 degree temperature difference between a downtown parking lot to a nature reserve away from buildings.
Tap HERE to track current temperatures with our interactive weather maps.
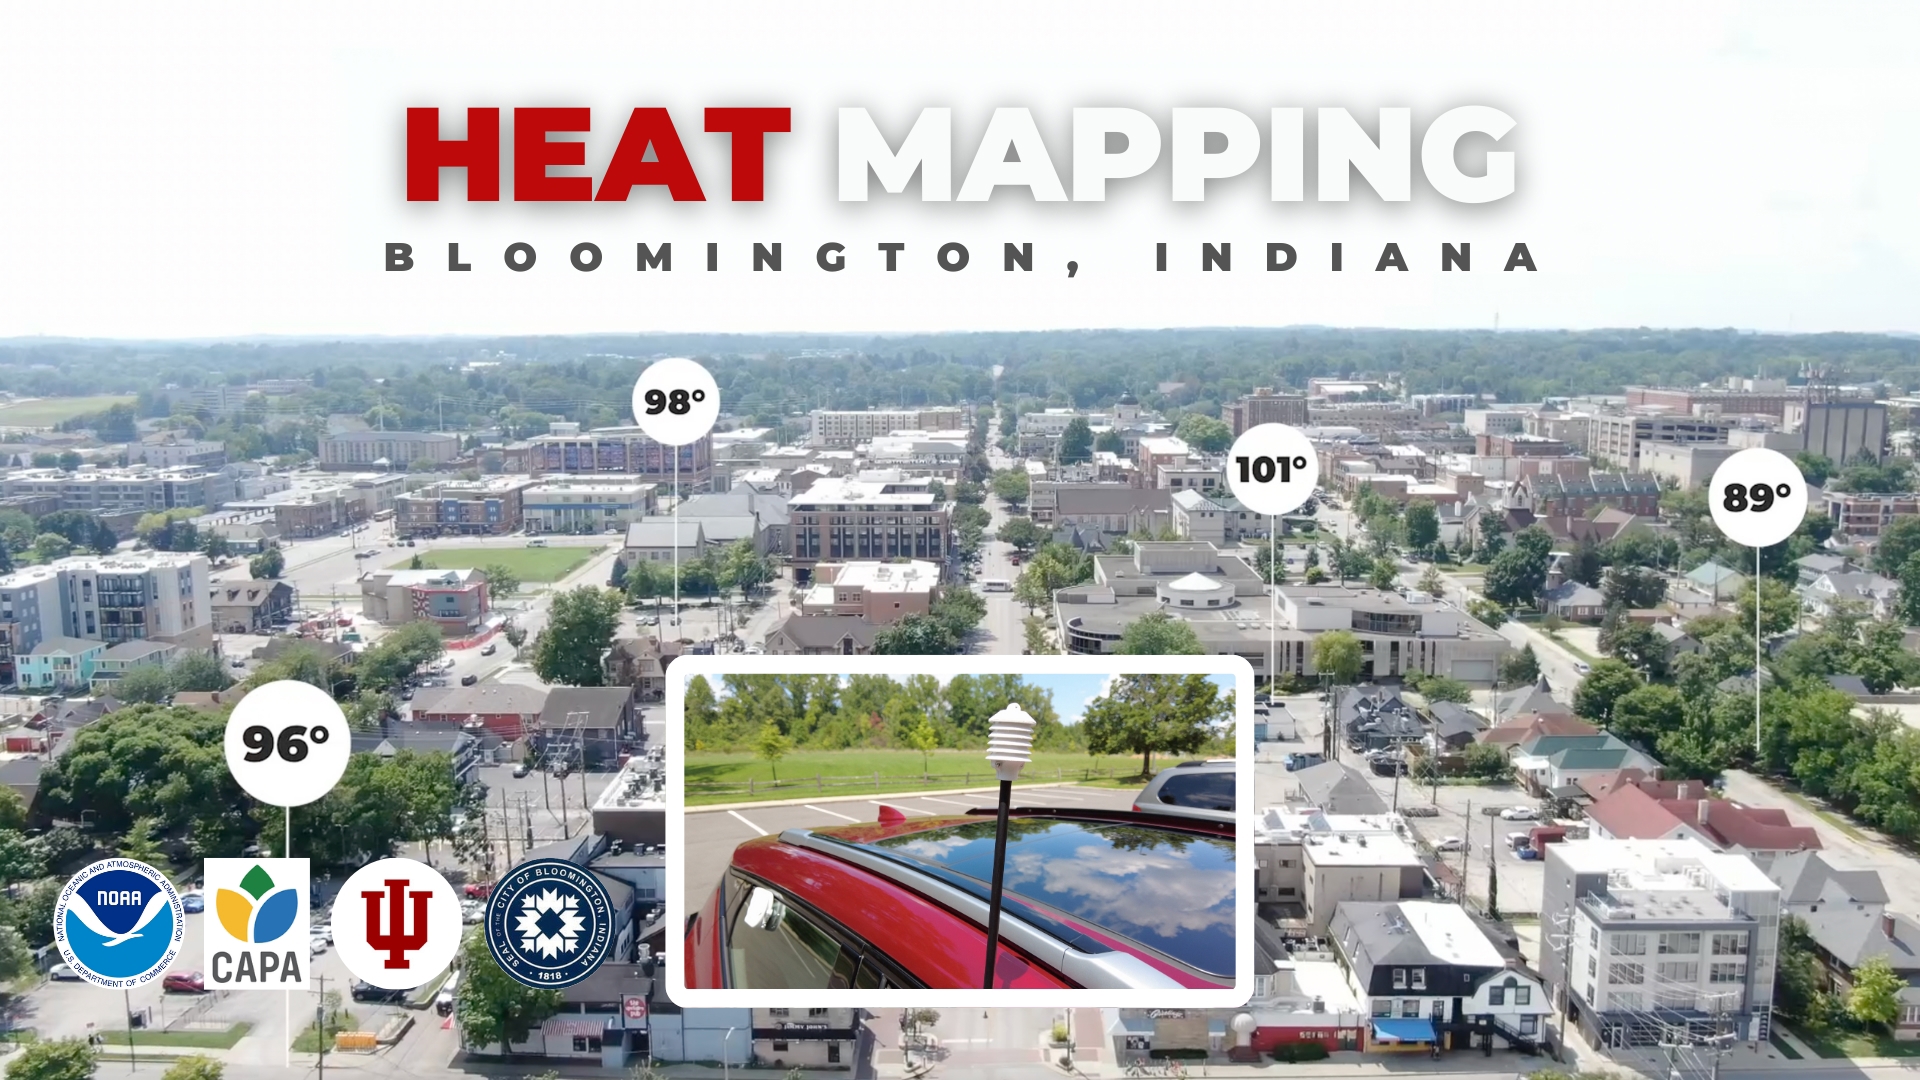
NOAA wants to map the urban heat island for cities across the country. This year Bloomington, Indiana was selected to receive federal funding to create a map. Twelve other cities were also included.
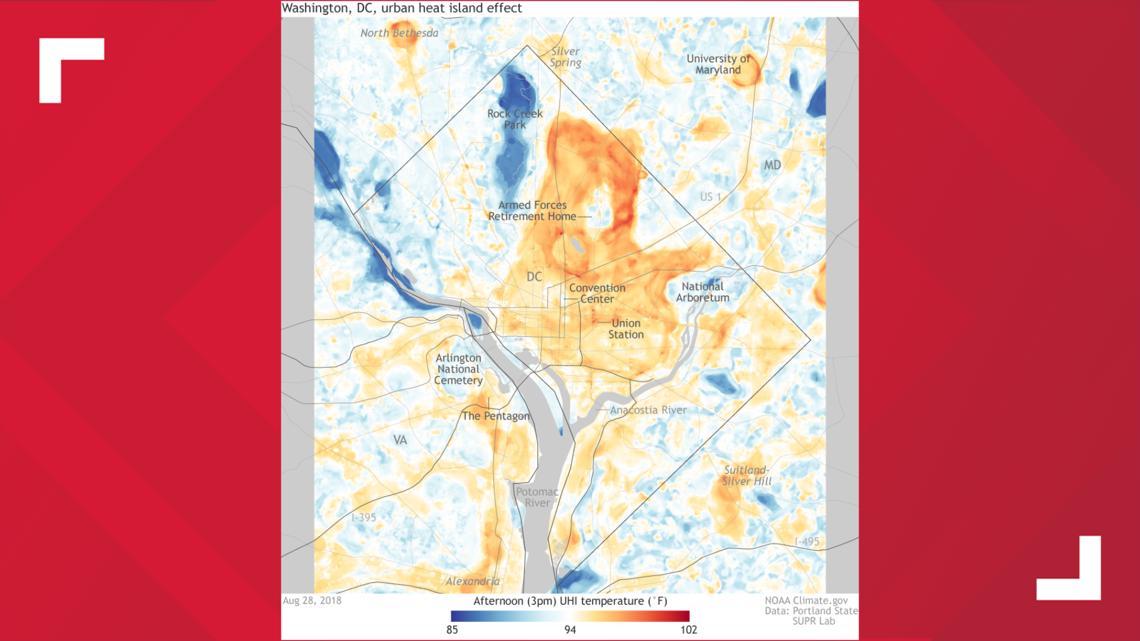
We included the urban heat island effect map for Washington, D.C. Notice how urban areas with lots of concrete and asphalt (orange) is much hotter than park and preserve areas (blue). Soon Bloomington, Indiana will have a map like this.

Heat mapping day | August 4, 2024
We visited Bloomington on the day of the heat map campaign. There were three waves of volunteers to gather data at different parts of the day: morning, afternoon, and evening. We spoke with Shawn Miya, Assistant Director of Sustainability for the City of Bloomington: "Volunteers are placing heat sensors and air quality sensors on their cars, and they're going to be driving around predetermined routes around the city. They're going to be collecting heat data as well as air quality data, and this will help us to understand how heat is distributed across our city."

Sunday, August 4th was chosen because of the hot weather (low 90s), slow wind speeds, and mostly sunny skies. Other weather variables like clouds and rain could wash the data out and make it unclear.
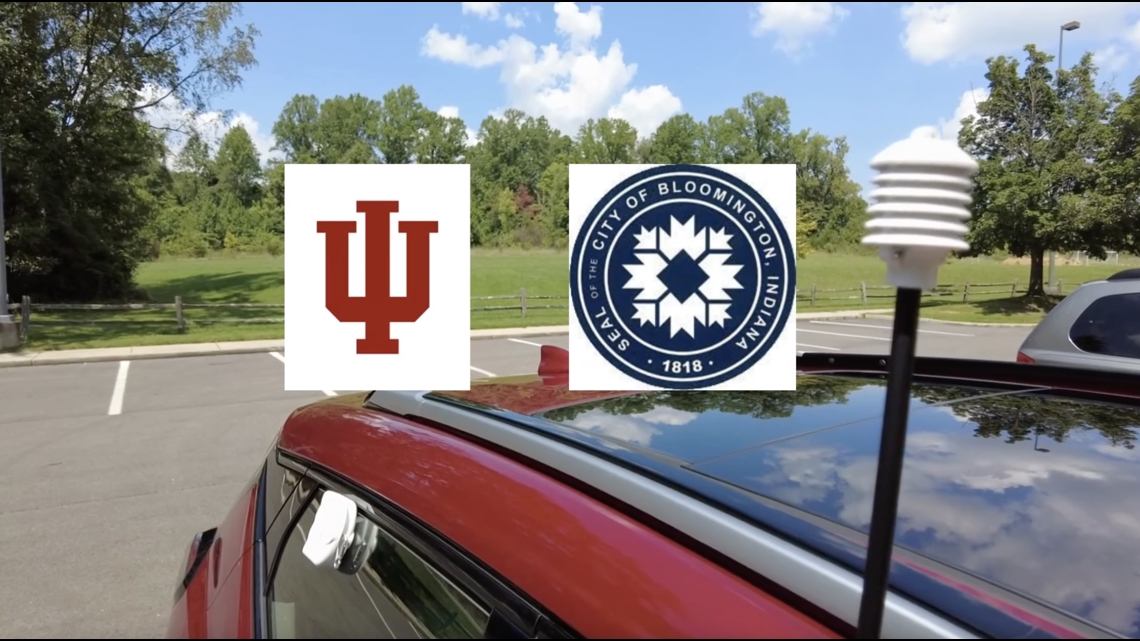
Indiana University partnered with the City of Bloomington to gather volunteers and to process this new heat information. IU's Luddy School of Informatics is looking forward to working with the high-resolution data to understand the urban heat island effect of the city. They can go beyond general concepts and see how it exactly impacts Bloomington.
The volunteers met at the RCA Community Park to pick up their temperature sensors and air quality sensors. They were wedged in outside the window of their vehicles. Teams of two were given different routes to drive, staying under 35 MPH. They drove for an hour and then return the sensors which collected temperature, humidity particulate, and location data every second.

d
Why map this data?
NOAA doesn't just want to know the temperature around town. They want to understand where the hot spots are. Once the most significant ones are located and mapped, then there can be future projects to build new infrastructure that reflects heat rather than absorbs it.
Dr. Habeeb, professor at IU Luddy School of Informatics and Director of Healthy Cities Lab, explains what we can do with the data: "If we understand which areas are hottest, then we can design different heat mitigation strategies, such as albedo strategies, where we're looking at cool roofs or cool pavings, or green infrastructure strategies where we're increasing green space, such as more trees or grass within our communities, in order to help with that, decrease those extreme heat exposures."
Extreme heat is the number one weather-related cause of death in the United States. If we can understand the distribution of heat in a specific city, we can better help those who live in those zones.
When will the data be available?
All the data were sent to CAPA, the vendor used by NOAA to create the map. This map and all its data will be available by the end of September. All of this will be publically accessible.
Once it is available, the city of Bloomington will add it to their Bloomington's Climate Resilience Plan. The data will "inform tree planting throughout the city, and provide a framework for creating cool corridors along routes of high pedestrian and bicycle use.
-13News Meteorologist Matt Standridge