INDIANAPOLIS — Even as Indiana businesses reopen and travel restrictions end, there is no end in sight when it comes to collecting information about COVID-19. Researchers at the Regenstrief Institute in Indianapolis have been gathering and analyzing clinical health care data from across the state. They are now using that data to detect important coronavirus trends and to identify developing COVID-19 hotspots.
The trends have been changing daily, keeping Regenstrief analysts and health care officials on constant watch.
“We want to be able to very early on identify where there may be some concerning trends,” said Shaun Grannis, Regenstrief’s vice president of data and analytics. “The earlier we can respond to what we're seeing, the better.”
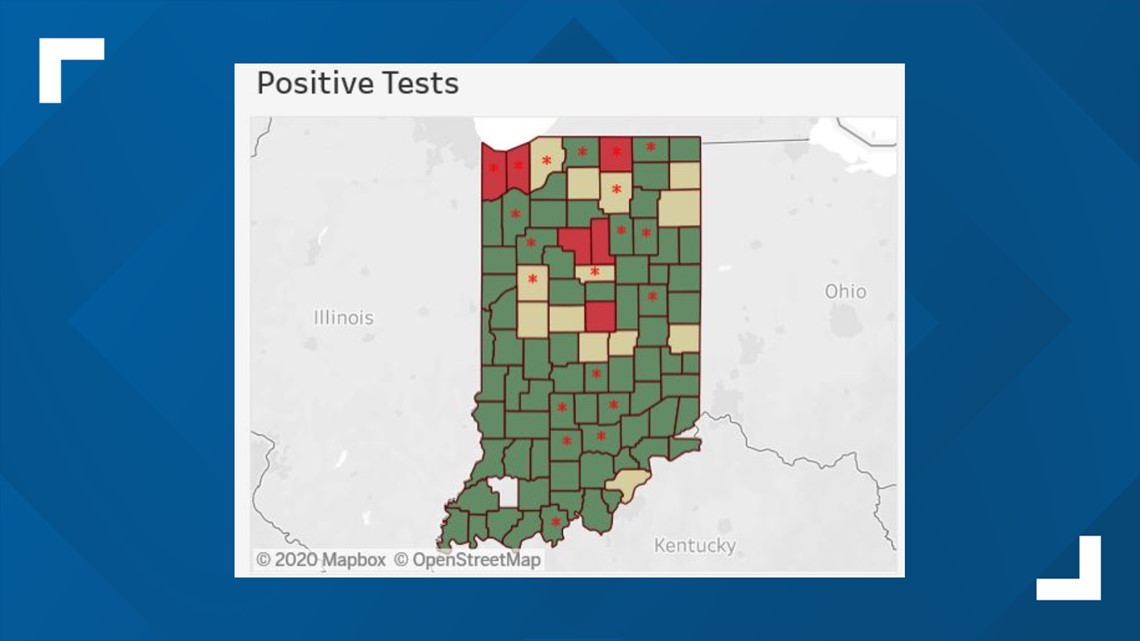
Grannis and other analysts at the research institute have been uploading the numbers on an Indiana COVID-19 Trends dashboard where anyone can see them. The data is presented in color-coded maps and graphs to make it easy to understand. It shows statewide and county-by-county trends, tracking where coronavirus cases are falling and where they are on the rise.
And make no mistake, COVID-19 cases are on the rise in several Indiana counties, according to the latest data from the institute.
Where new COVID-19 cases are on the rise
The most closely-watched data is the number of positive COVID-19 tests reported throughout the state. On Regnstrief’s Indiana trend map, counties that show a 10-day overall decline in new coronavirus test results are highlighted in green. Those showing an increased number of positive COVID-19 test results appear in red, while counties that have an inconclusive trend line appear in a yellowish color.
“It’s a tool that helps us focus our resources and focus our attention where it needs to be,” Grannis told 13News Wednesday afternoon, when the majority of Indiana counties were highlighted in green. On that day, nine counties were marked as having increased positive COVID-19 test results.


By Thursday afternoon, the number of red counties – indicating an increased trend of coronavirus test results – had dropped to six. But at the same time, another Indiana 20 counties were flagged as showing possible “early warning” signs of increased COVID-19 activity resulting from a jump in positive test results within the past two days.
“If we see increased counts, we want people to be aware of that, even though a county might be green,” Grannis said. “We do see some early increases that might be worthy of further investigation … the goal is, of course, to respond as soon as possible to make the best decisions possible to mitigate the spread of the coronavirus.”
Regenstrief trend maps showed the overall status of Indiana’s positive COVID-19 test results was declining Tuesday, increasing Wednesday, and inconclusive Thursday.
“The data suggests to us Indiana is doing well and I'm encouraged by what we're seeing. That does not mean that we cease being vigilant,” Grannis explained.
A closer look at the Regenstrief data and trend maps explains why.
They shows Hamilton, Miami, Cass, Lake, Porter and Elkhart counties are trending upward on the number of positive COVID-19 cases over the past ten days.
Counties like Johnson, Bartholomew, Monroe, Delaware, Howard and Tippecanoe counties are in the “early warning” category, along with many of the most populous counties in northern Indiana.
Why are there more cases?
In Boone County, which has seen a recent jump in COVID-19 cases, health officials have been tracking the trend data closely and admit they are concerned.
“Yes, we have definitely noticed an increase in cases,” said Claire Haughton, public health educator at the Boone County Health Department. She believes the availability of more testing, as well as more county residents engaging in social activities since the start of the Memorial Day weekend, help explain the increased cases now being recorded in that county.
“With the state opening up and different organizations opening up, it's expected to see an increase in cases, so we're just trying to remain optimistic that most of those cases don't require hospitalization,” Haughton said.
The Regenstrief data also details hospitalizations, ER visits and other data linked to COVID-19. Those trends show decreasing rates throughout most of the state. Only Marion County is currently trending higher for hospital admissions, and Regenstrief’s data trend website suggests Marion and Hamilton counties are showing possible early warnings signs of increased ER visits.
“It's a tool that helps us focus our resources and focus our attention where it needs to be,” Grannis told 13News. He hopes state residents and health officials will take time to explore the data that accompanies each map and graph to better understand the trends and how researchers are tracking them.
“The purpose of this trending is to allow people who want to monitor and look for unusual changes to be able to dive deeper,” he explained.
RELATED: Indiana coronavirus updates: ISDH updates coronavirus case count, correction from Wednesday
Analysts and health care officials tell 13News the current statewide trends should provide reason for optimism. But they also say the trends present a clear warning that the virus has not disappeared and, in some places, is on the rise.
“Definitely do not let your guard down,” Haughton said. “We’re not over this. Even though the state is opening up, we still have to take our proper precautions with wearing masks and social distancing and not going in out in public as much as we used to. Unfortunately, the virus is still here and people are still getting sick.”
To date, more than 41,000 Hoosiers have been diagnosed with COVID-19 and more than 2,300 residents have died from the virus, according to the Indiana State Department of Health.
To view the Indiana COVID-19 trend data, go to the Regenstrief Institute data dashboard and click on the word “Trends.”

